Management buzzwords, such as “management by objectives” (MBO) and “total quality management” (TQM), come and go. Often perceived as vague, complex, or confusing, they fade into the past before most of us really understand or appreciate their true benefit.
 But benchmarking is one recently popularized concept that deserves serious consideration. The concept involves a comparative analysis of industry operating factors, financial ratios, and business practices that answer the question: “How does my community really stack up?” Benchmarking has seen limited application in senior housing, but the concept will eventually become a management imperative for many senior housing organizations.
Benchmarking – comparing your community against regional and national organizations – can be an early warning system. Benchmarking can identify impending problems and also provide a good way to demonstrate the sound performance of your operation.
Not-for-profits will find benchmarking especially beneficial. Too many not-for-profits rationalize operational inefficiencies as being inevitable – a byproduct of fulfilling their mission. In fact, non-profits can implement change and realize substantial financial improvements. Failure to do so is compromising their effectiveness and seriously impairing their long run mission objectives. As a result, many boards of directors are asking increasingly pragmatic and penetrating questions, such as the ones at the beginning of this chapter. Bond underwriters, rating agencies, and accreditation organizations are also looking for increasingly sophisticated measures of success. Benchmarking may be the answer. Let’s look at two vital indicators – the financial pulse of your operation.
The operating expense ratio shows the relationship between revenues and expenses. The operating expense ratio represents total cash operating expenses divided by net revenues. It generally excludes depreciation, interest, taxes, principal payments, and property leasing expenses. It should include a management fee and a modest allocation into a capital reserve fund for future building improvements.
The expense per resident-day index is based solely on operating expenses. It is your total annual operating expenses (as defined above) divided by your total resident population times 365 days.
Always look for symptoms. Typically, there are two possible problems:
- Revenues may be too low;
or . . .
- Expenses may be too high.
Say, for example, your operating expense ratio appears high. By computing your expenses per resident-day index, you can usually identify the source of the problem. For example, if your operating expenses per resident-day are also high, it is likely that your primary problem is excessive expenses and not suppressed revenues.
Nine Major Benefits of Benchmarking
Still not sold on benchmarks? Here are nine major benefits. Benchmarks will:
- Improve your financial position.
- Increase operational efficiency.
- Develop competitive and creative pricing strategies.
- Better position your products and services in the competitive marketplace.
- Assist in developing new ways to increase resident satisfaction.
- Introduce new quality of life initiatives.
- Enhance the perceived value of your services.
- Increase community value; your exit equity or your refinancing potential.
- Generate increased, ongoing cash flow.
Other specialty areas of your operation that could benefit from benchmarking include accounting, housekeeping, routine and preventive maintenance, sales and marketing, and overall capital investment planning. Perhaps the best targets for benchmarking are the things that cost you the most money, particularly those that directly affect the perceived value of your community. Staffing, for instance, represents over 60 percent of total operating costs in senior living – and adequate staffing ratios are important to residents and their families. Benchmarking can help you define realistic staffing patterns that strike a balance between high operational efficiency and optimum resident satisfaction.
Benchmarking also benefits food and beverage operations. Not only does meal service account for up to one-third of a community’s operating costs, but it is usually perceived by residents and their families as one of the most important services offered – and it’s the one mentioned most critically in resident satisfaction surveys. Certainly, food service is an area in which it doesn’t pay to cut corners. Yet, finding a way to improve efficiency could really pay off, if it can be done without hurting quality or resident satisfaction.
Benchmarking can sharpen your focus and provide a bridge that links your strategic goals and objectives with desired expected outcomes. Finally, the process will force you to position, operate and price your community more effectively.
Call to Action
The return on the cost of a benchmarking operations analysis investment is a no brainer. The significant return on investment makes operations analysis and benchmarking one of the most beneficial initiatives you could possibly execute. It’s true that our primary mission is to consistently deliver high standards of care and quality of life to our residents. But in doing so, we can’t let this noble objective either mask or oversimplify a rationale for grossly inefficient operations. For your community, it may be time to bite the bullet.
I’ve not yet conducted an operations analysis that did not result in a permanent, ongoing savings of at least $50,000 per year. A comprehensive third-party analysis typically involves a one time cost typically ranging from $18,000 to $25,000 depending upon the size of the community. Call MDS today and let’s see if benchmarking can help reduce your community’s expenses.
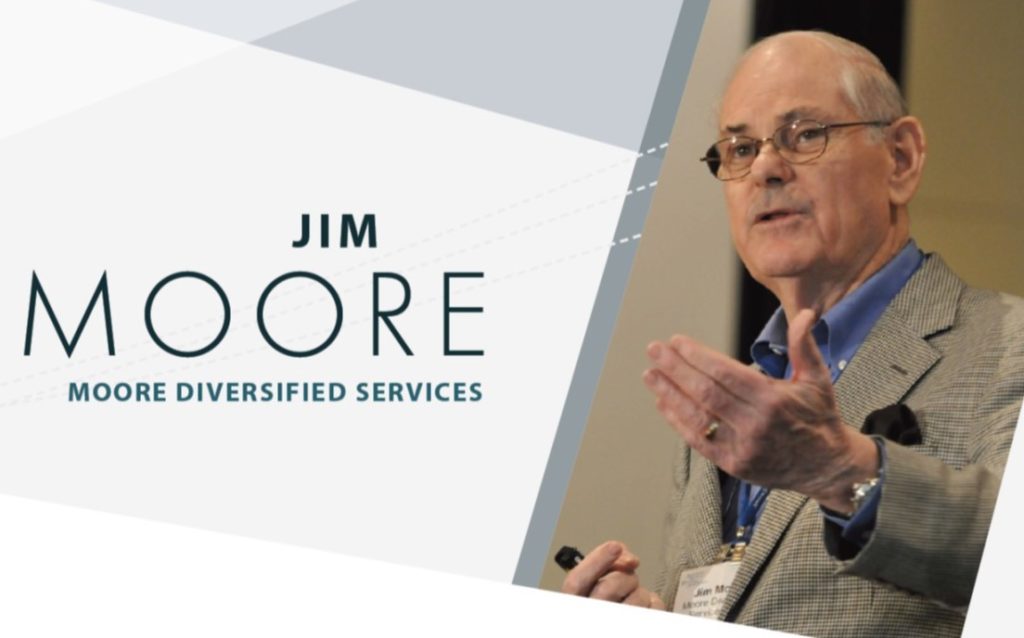
The above content was taken from Jim Moore’s book Independent Living and CCRCs: Survival, Success & Profitability Strategies for Not-for-Profit Sponsors and For-Profit Owner/Operators. For a copy or to set up an appointment with MDS, call (817)731-4266 or email Jim at JimMoore@m-d-s.com


